L O A D I N G
Power BI by Microsoft is a powerful tool for data analytics, helping you turn raw data into actionable insights. This guide will cover the essentials of using Power BI to enhance your data analysis and visualization.
1. What is Power BI?
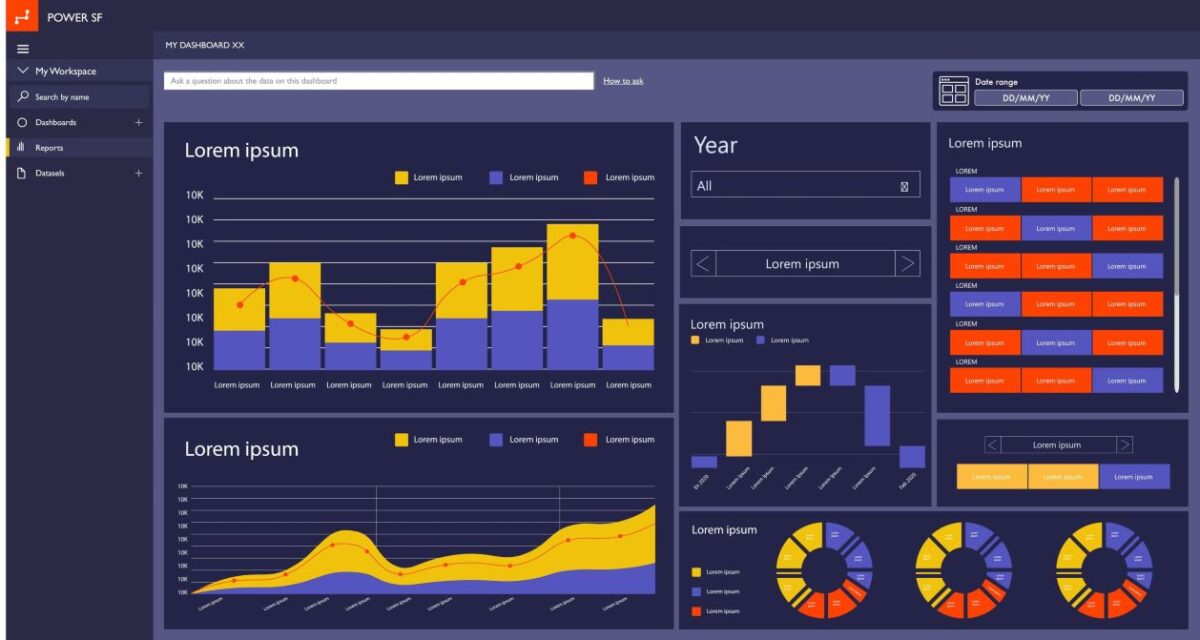
Power BI is a suite of business analytics tools that allows users to create interactive reports and dashboards. It integrates with various data sources and provides powerful visualization capabilities.
2. Creating Visualizations
1. Connect to Data:
Import data from sources like Excel, databases, or online services. Use Power Query to clean and transform data as needed.
2. Build Reports:
Choose Visualizations: Select from charts, maps, tables, and other visuals to represent your data effectively.‎ ‎ ‎ ‎ ‎ ‎ ‎ ‎‎ ‎ ‎ ‎ ‎ ‎ ‎ ‎ ‎ ‎ ‎ ‎ ‎ ‎ ‎ ‎ ‎ ‎ ‎ ‎ ‎ ‎ ‎ ‎ ‎ ‎ ‎ ‎ ‎ ‎ ‎ ‎ ‎ ‎ ‎ ‎ ‎ ‎ ‎ ‎ ‎ ‎ ‎ ‎ ‎ ‎ ‎ ‎ ‎ ‎ ‎ ‎ ‎ ‎ ‎ ‎ ‎ ‎ ‎ ‎ ‎ ‎ ‎ ‎ ‎ ‎ ‎ ‎ ‎ ‎ ‎ Customize: Adjust formatting and interactivity to enhance user experience.
3. Advanced Features
1. DAX (Data Analysis Expressions):
Use DAX to create custom calculations and aggregations for deeper insights.
2. Power BI AI Capabilities:
Leverage AI-driven insights and integration with Azure Cognitive Services for advanced analytics.
4. Best Practices
Design Effectively:‎ ‎ ‎ ‎ ‎ ‎ ‎ ‎ ‎ ‎ ‎ ‎ ‎ ‎ ‎ ‎ ‎ ‎ ‎ ‎ ‎ ‎ ‎ ‎ ‎ ‎ ‎ ‎ ‎ ‎ ‎ ‎ ‎ ‎ ‎ ‎ ‎ ‎ ‎ ‎ ‎ ‎ ‎ ‎ ‎ ‎ ‎ ‎ ‎ ‎ ‎ ‎ ‎ ‎ ‎ ‎ ‎ ‎ ‎ ‎ ‎ ‎ ‎ ‎ ‎ ‎ ‎ ‎ ‎ ‎ ‎ ‎ ‎ ‎ ‎ ‎ ‎ ‎ ‎ ‎ ‎ ‎ ‎ ‎ ‎ ‎ ‎ ‎ ‎ ‎ ‎ ‎ ‎ ‎ ‎ ‎ ‎ ‎ ‎ ‎ ‎ ‎ ‎ ‎ ‎ ‎ ‎ ‎ ‎ ‎ ‎ ‎ ‎ ‎ ‎ ‎ ‎ ‎ ‎ ‎ ‎ ‎ ‎ ‎ ‎ ‎ ‎ ‎ ‎ ‎ ‎ ‎ ‎ ‎ ‎ ‎ ‎ ‎ ‎ ‎ ‎ ‎ ‎ ‎ ‎ ‎ ‎ ‎ ‎ ‎ ‎ ‎ ‎ ‎ ‎ ‎ ‎ ‎ ‎ ‎ ‎ ‎ ‎ ‎ ‎ ‎ ‎ ‎ ‎ ‎ ‎ ‎ ‎ ‎ ‎ ‎ ‎ ‎ ‎ ‎ ‎ ‎ ‎ ‎ ‎ ‎ ‎ ‎ ‎ ‎ ‎ ‎ ‎ ‎ ‎ ‎ ‎ ‎ ‎ ‎ ‎ ‎ ‎ ‎ ‎ ‎ ‎ ‎ ‎ ‎ ‎ ‎ ‎ ‎ ‎ ‎ ‎ ‎ ‎ ‎ ‎ ‎ ‎ ‎ ‎ ‎ ‎ ‎ ‎ ‎ ‎ ‎ ‎ ‎ ‎ Keep reports user-friendly and visually consistent.
Optimize Performance:‎ ‎ ‎ ‎ ‎ ‎ ‎ ‎ ‎ ‎ ‎ ‎ ‎ ‎ ‎ ‎ ‎ ‎ ‎ ‎ ‎ ‎ ‎ ‎ ‎ ‎ ‎ ‎ ‎ ‎ ‎ ‎ ‎ ‎ ‎ ‎ ‎ ‎ ‎ ‎ ‎ ‎ ‎ ‎ ‎ ‎ ‎ ‎ ‎ ‎ ‎ ‎ ‎ ‎ ‎ ‎ ‎ ‎ ‎ ‎ ‎ ‎ ‎ ‎ ‎ ‎ ‎ ‎ ‎ ‎ ‎ ‎ ‎ ‎ ‎ ‎ ‎ ‎ ‎ ‎ ‎ ‎ ‎ ‎ ‎ ‎ ‎ ‎ ‎ ‎ ‎ ‎ ‎ ‎ ‎ ‎ ‎ ‎ ‎ ‎ ‎ ‎ ‎ ‎ ‎ ‎ ‎ ‎ ‎ ‎ ‎ ‎ ‎ ‎ ‎ ‎ ‎ ‎ ‎ ‎ ‎ ‎ ‎ ‎ ‎ ‎ ‎ ‎ ‎ ‎ ‎ ‎ ‎ ‎ ‎ ‎ ‎ ‎ ‎ ‎ ‎ ‎ ‎ ‎ ‎ ‎ ‎ ‎ ‎ ‎ ‎ ‎ ‎ ‎ ‎ ‎ ‎ ‎ ‎ ‎ ‎ ‎ ‎ ‎ ‎ ‎ ‎ ‎ ‎ ‎ ‎ ‎ ‎ ‎ ‎ ‎ ‎ ‎ ‎ ‎ ‎ ‎ ‎ ‎ ‎ ‎ ‎ ‎ ‎ ‎ ‎ ‎ ‎ ‎ ‎ ‎ ‎ ‎ ‎ ‎ ‎ ‎ ‎ ‎ ‎ ‎ ‎ ‎ ‎ ‎ ‎ ‎ ‎ ‎ ‎ ‎ ‎ ‎ ‎ ‎ ‎ ‎ ‎ ‎ ‎ ‎ ‎ ‎ ‎ ‎ ‎ Optimize data models and queries to improve performance.
Ensure Security: ‎ ‎ ‎ ‎ ‎ ‎ ‎ ‎ ‎ ‎ ‎ ‎ ‎ ‎ ‎ ‎ ‎ ‎ ‎ ‎ ‎ ‎ ‎ ‎ ‎ ‎ ‎ ‎ ‎ ‎ ‎ ‎ ‎ ‎ ‎ ‎ ‎ ‎ ‎ ‎ ‎ ‎ ‎ ‎ ‎ ‎ ‎ ‎ ‎ ‎ ‎ ‎ ‎ ‎ ‎ ‎ ‎ ‎ ‎ ‎ ‎ ‎ ‎ ‎ ‎ ‎ ‎ ‎ ‎ ‎ ‎ ‎ ‎ ‎ ‎ ‎ ‎ ‎ ‎ ‎ ‎ ‎ ‎ ‎ ‎ ‎ ‎ ‎ ‎ ‎ ‎ ‎ ‎ ‎ ‎ ‎ ‎ ‎ ‎ ‎ ‎ ‎ ‎ ‎ ‎ ‎ ‎ ‎ ‎ ‎ ‎ ‎ ‎ ‎ ‎ ‎ ‎ ‎ ‎ ‎ ‎ ‎ ‎ ‎ ‎ ‎ ‎ ‎ ‎ ‎ ‎ ‎ ‎ ‎ ‎ ‎ ‎ ‎ ‎ ‎ ‎ ‎ ‎ ‎ ‎ ‎ ‎ ‎ ‎ ‎ ‎ ‎ ‎ ‎ ‎ ‎ ‎ ‎ ‎ ‎ ‎ ‎ ‎ ‎ ‎ ‎ ‎ ‎ ‎ ‎ ‎ ‎ ‎ ‎ ‎ ‎ ‎ ‎ ‎ ‎ ‎ ‎ ‎ ‎ ‎ ‎ ‎ ‎ ‎ ‎ ‎ ‎ ‎ ‎ ‎ ‎ ‎ ‎ ‎ ‎ ‎ ‎ ‎ ‎ ‎ ‎ ‎ ‎ ‎ ‎ ‎ ‎ ‎ ‎ ‎ ‎ ‎ ‎ ‎ ‎ ‎ ‎ ‎ ‎ ‎ ‎ ‎ ‎ ‎ Implement security measures to protect data and manage permissions.
Conclusion
Power BI is a versatile tool for transforming data into insightful visualizations and reports. By mastering its features, you can unlock valuable insights and drive informed decision-making.
Categories: Blog

Post a comment